Linaro MAP is a high-performance profiler designed to optimize the efficiency of software running on multicore processors.

Analyze performance bottlenecks for both parallel and single-threaded applications

Generate in-depth analysis of pthreads, OpenMP, Sycl, OpenACC and MPI-based code

Identify performance issues relating to communication and workload imbalances in multi-process codes
“The software developers in our group use Linaro Forge on an almost daily basis, not only for finding and fixing errors but also in order to get a more profound insight into program execution and data states.”
Dr. Aurel Neic, Postdoctoral Researcher, Institute of Biophysics Medical University of Graz

Linaro MAP allows you to profile your code without distorting application behaviour, enabling you to profile realistic test cases with typically less than 5% runtime overhead.

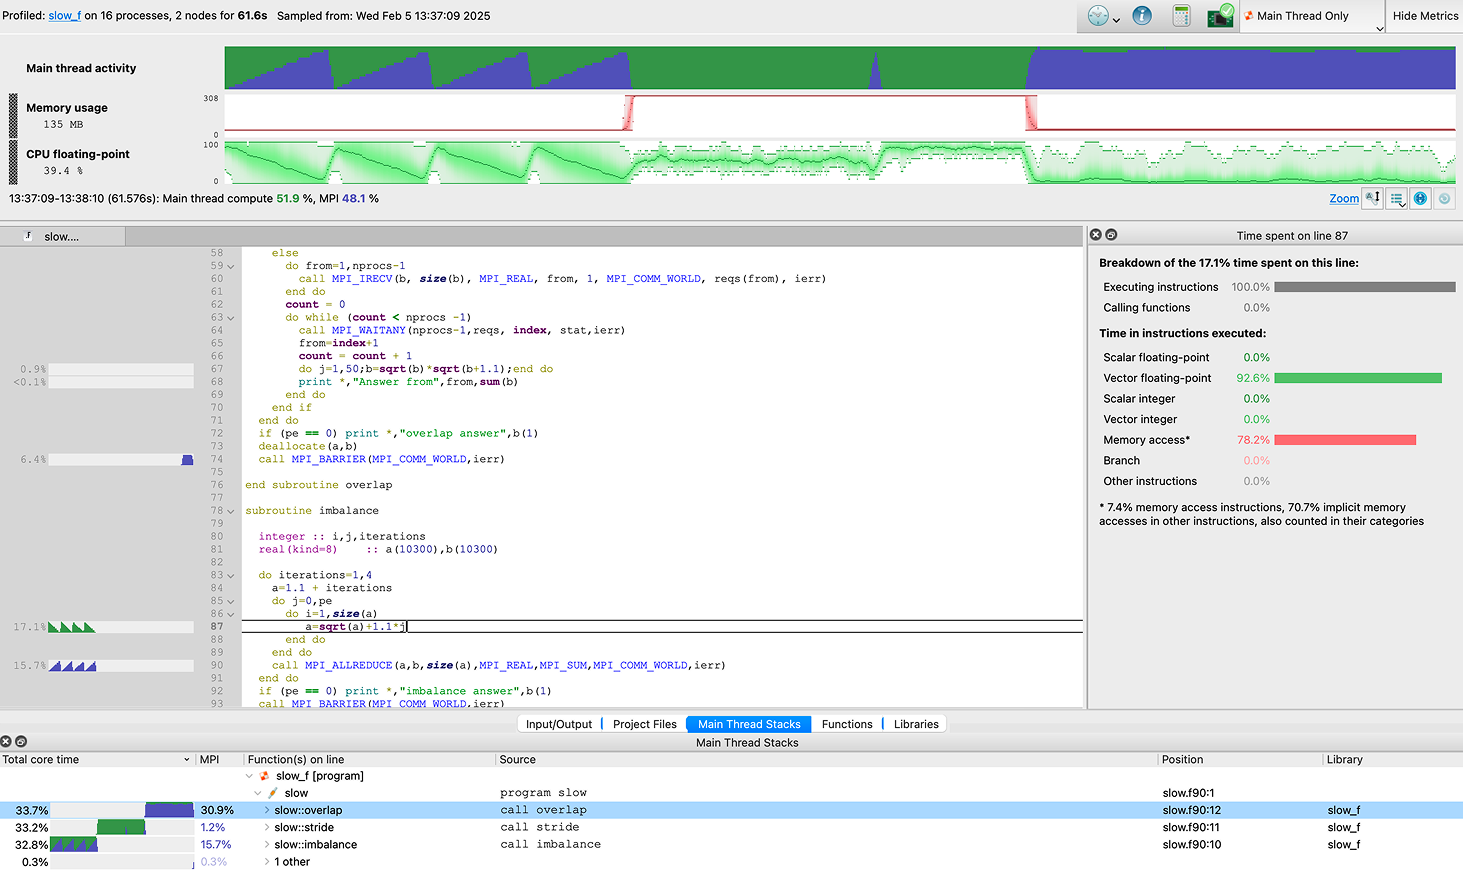
Linaro MAP generates in-depth analysis and bottleneck pinpointing to the source line, allowing you to quickly identify issues and optimize performance.

Linaro MAP provides a wide range of performance indicators, including MPI metrics, Perf counters, I/O metrics and memory usage to further help you ensure your performance is always being optimized.